Mission
The Creation of Gothic Architecture Project [COGA] seeks to understand the emergence of the Gothic style by examining everything simultaneaously.
The site is more than a resource: it is a tool for discovery.
We need a firmer chronology with as much detail as we can muster that integrates the
natural historical boundaries
The collection of on-site surveys of 1600 buildings throws up very different results than from single buildings.
It is more like a panorama than a street view.
The data includes EVERY church from the region in which Gothic was created, being the Greater Paris Basin between 1060 and 1250,
and especially between the First and Fourth Crusades.
This mass of evidence is the body that underpins the COGA project.
You are encouraged to use these resources to draw your own conclusions, and even share them with me.
Methodology
The work of the past fifty years is contained on this site, and has shown that
1. Our chain of logic seems able to set the scene for determining who did what, when, and where.
2. A holiistic methodology can, through systematic attention, open a new chapter in Gothic studies.
3. Synchronising campaigns and phases with the carvers that worked in them stands to revolutionise the chronology of Early Gothic.
4. The combination of the data plus the dating analyses in
The Ark of God
can, through this holistic analysis, create a more accurate and detailed dating than we have had before.
5. The process has been grounded in consistent
dating procedures
of course by course analysis of the major buildings, inter-linked with all other data.
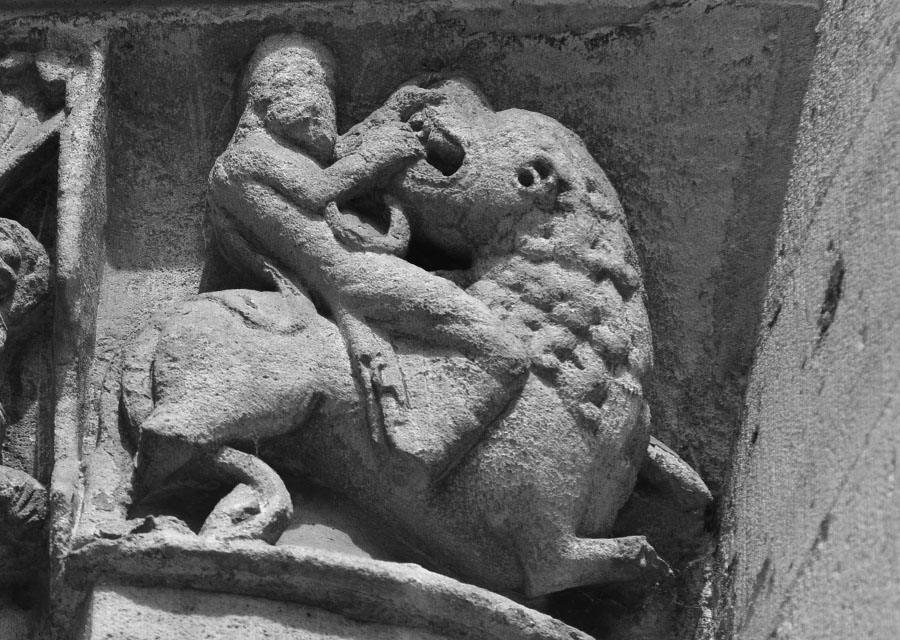
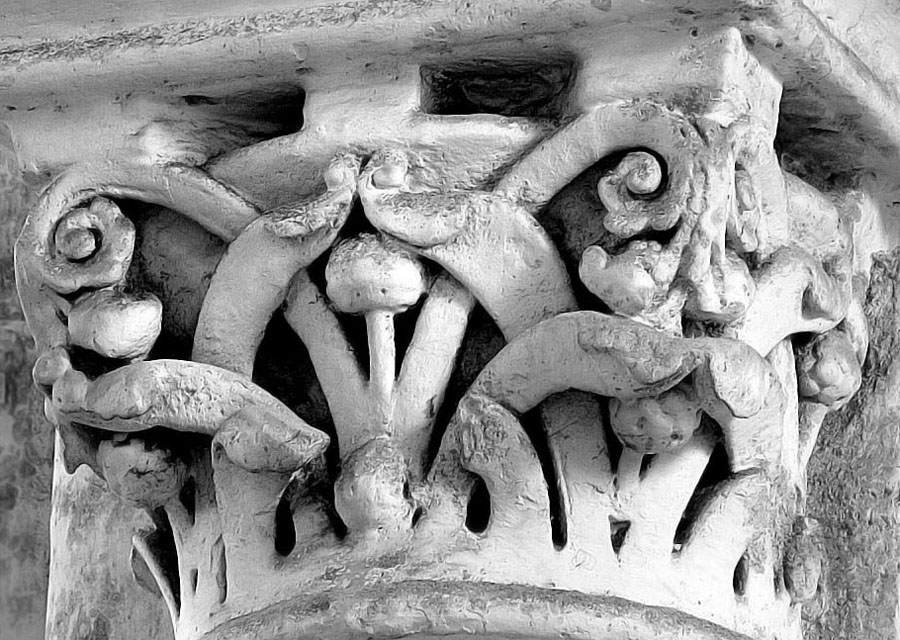
6. The unique collection of 40k carved CAPITALS is a major resource for establishing the chronology.
Early conclusions from 1984 in
The Art Bulletin provide a basic background to the Survey.
Resources on the COGA site
Filtering
Access to the data begins with a search, made possible through an effective filtering system. You can choose any combination of dates, priority, department, region, affiliation and building features.
Results can be viewed in many different ways, including sortable lists, thumbnails, graphs, timelines and maps. These powerful search features provide innumerable possibilities for research.
You can start looking at buildings by clicking on the "Search for Buildings" buttons on the left provided throughout the site.
Priority has been given to those with carved or decorative features, being more than half.
List of major churches.
Synopses page
On the left each building has a photo and basic geographical and historical information. Navigation buttons allow you to see the resources available for that building. To the right, a timeline integrated with a bar chart provides a snapshot of the relative expenditure during each decade. It is a visual depiction of the quantity and flow of work.
Each of the higher priority buildings has a "synopsis", which is a preliminary division of the construction history of the building by phases. These are not necessarily the same as separate campaigns under different masters, but definable sections of work. Some buildings are more detailed than others.
Typical synopsis.
Capitals
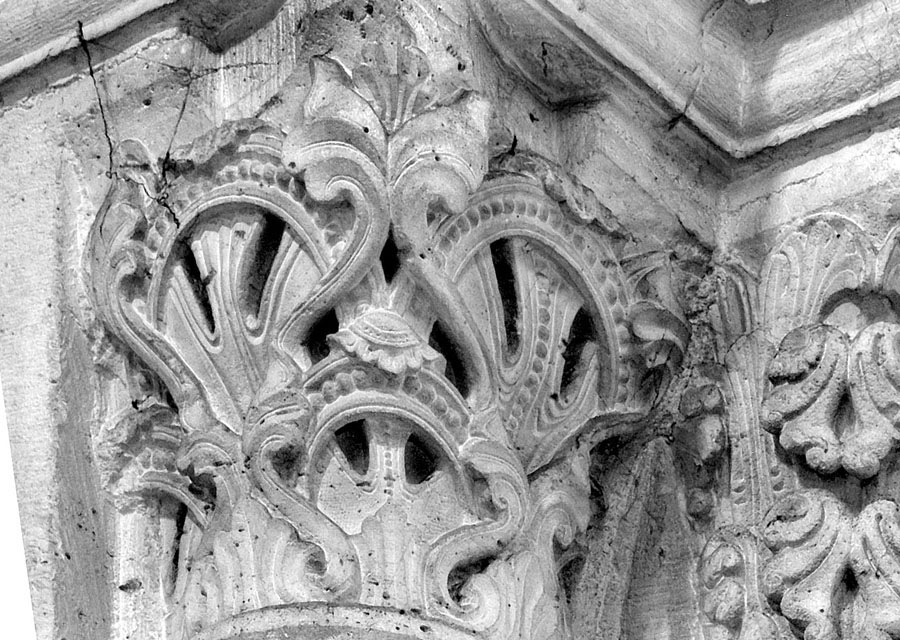
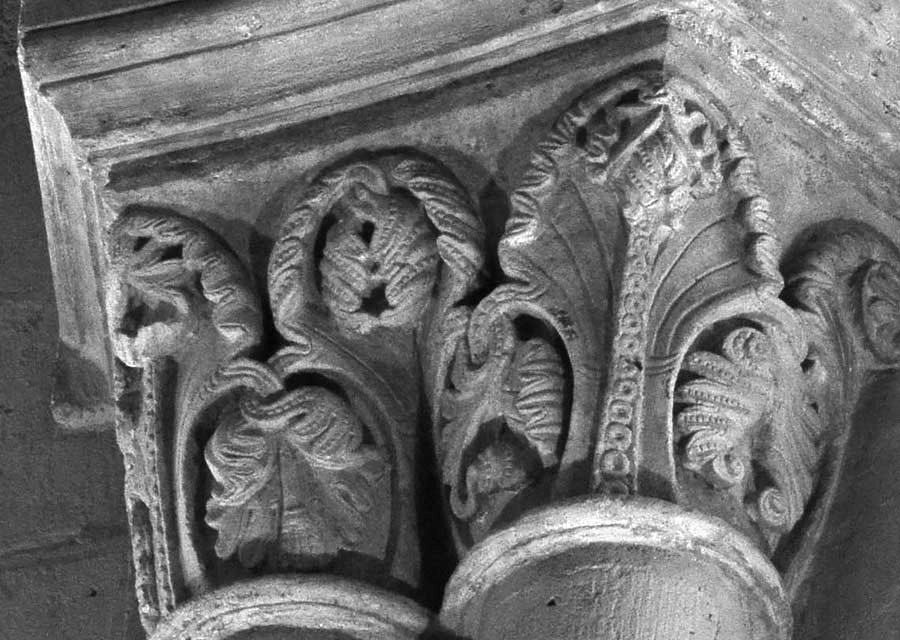
A major product of the site surveys has been the documentation of sculpted capitals. Over many years I have photographed every carved capital in the region and used their stylistic connections and evolution as the basis for establishing a firmer chronology for these buildings than we have had before. Most have been published in my five-volume work, The Ark of God.
My ongong analysis of the capitals is presented here. Though unfinished, if not unfinishable, I began by grouping them by features and carving manner, and have given each an alias as this helps me keep the groups clear in my mind. They are not meant to indicate individuals, though they may, and some of these have been edited into separate different levels of stylistic kinship.
I include them to provide additional confirmation for judgments on dating, and to more effectively visualize the evolution of carving across time and space.
Capitals in thumbnails and enlargements.
Rib Vaults
Buildings with the earliest rib vaults in Europe will be included. I have all this informaiton: Pages under construction.
Thumbnails
As it is often easlier to recognise building by their image we provide thumbnail for whichever selection of works you have chosen.
Maps
Using the information provided in the synopses, the maps allow us to show the geographical relationships among whichever group of buildings you select. Colors represent various regions whose boundaries are determined by political histories, commonalities in details and contemporaneity of construction. Maps can be viewed by region or by decade of construction. As the data is analyzed and integrated into the database, opportunities for additional modes of presentation reveal themselves. Buildings might be mapped by other factors such as affiliation, cost, and features.
Map of major churches.
Profiles
The profile templates will be included as they can indicate the template-maker, or master mason, in charge of the works.
From stylistic changes from one part of a building to another, to subtle changes in detailing, it is the anomalies that point to changes in design direction, and most likely, changes in master mason.
I have all this informatin; Pages under construction.
Costing
Costing analyses show the relative expenditure of each phase of construction using quantity surveying techniques. They are based on an arbitrary costing unit. Six units would pay for one small vaulted bay in an aisle about 3 metres square, or a small first-floor gallery. Such a bay would consist of an external wall with a small window, half of two columns about 3 meters tall, the floor and footings under them and the vault and roof overhead.
The costing analyses provide a clear visual presentation of building activity over time. Some pages have been created to compare quantity of masonry by decade, and the possible travels of recognisable carvers.
Graphing costs on Augustinian churches.
Panoramas
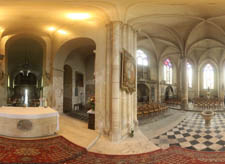
Panoramic imagery allows you to look around the interior of buildings as if you were actually there. No other technology provides a similar experience of the feeling of space within a building allowing you to wander around almost every nook and corner, seeing the details in context. Gross stylistic differences between various parts of buildings are evident, and even the more subtle building joints are often discernible.
Typical group of panoramas.
Photos
The photographs I took in the 1970s and 1980s are included as the prints were mounted on card at the time. They are provided as archival materials, but are not yet systematically separated nor indexed. I plan to do this in the future.
Mounted photos for Glennes.
Documents
The documentation of building activity in the medieval period is frustratingly spotty. Where we have identified primary source material that refers to specific construction work of a building, we have provided the original Latin, a translation, and identification of the source. The elements and details in buildings with documented dates may be compared with those in undocumented buildings to calibrate the timeline of construction activity throughout the Paris Basin.
Construction documents for Chartres.
Archive
During numerous visits to each of the sites during the 1970s and 80s, I accrued an extensive archive of notes, drawings, and documentary photographs. These contain sketches, notations, observations, preliminary building sequences and other invaluable information that are included unedited and often sketchily drawn, to ensure the safety of these rare resources. A primary goal of the COGA project is to digitize the components and features of each building so they may be assembled into dossiers that may be used to distinguish individual masons. This is an enormous task and wont be undertaken until the capital study has been completed.
Photocards and Notecards for St-Germer-de-Fly.
Models
It was our goal to allow users to experience the space of these medieval buildings by creating navigable 3-D models of each building. These would have conveyed information about building joints and construction campaigns in clear, visual form. Five buildings have been completed, and there are no plans to do more. In addition there are rotatable massing models of other buildings to show the projects in three dimensions.
The models could have provided the ideal vehicle for generating plans, elevations, and sections of each building.
Model of Nouvion phase by phase.
|
