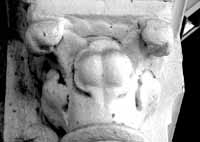
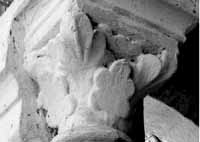
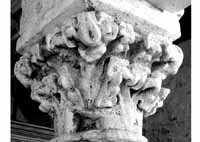
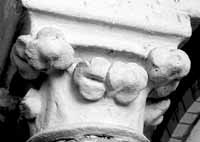
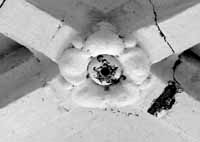
Bray, Saint-Georges
capitals in each phase

Building Data for Bray, Saint-Georges
- Type: Abbey
- Affiliation:
- Region: Picardie
- Department: Oise
- Coords: 49.237, 2.6939
- Surveyed: 1980-83, 2015
Capitals for Bray, Saint-Georges
 X
X
The building sequence is based on my on-site analysis of the construction history,
using the techniques developed on the cathedral of Chartres called toichology, and described in a number of publications.
The analysis of some of the smaller churches are more approximate than I would like, and need further analysis.
I have used 'phase' rather than 'campaign' to to identify a contiguous zone with similar elements.
A campaign would be defined by recognisable breaks and construction joints in the fabric: there may be a number of phases within a campaign.
One benefit is that separate programs by subcontractors, such as carvers, may be isolated, which is particularly useful in complex sections, such as portals.
Every phase has been assigned to a decade, so there may be more than one phase in a decade.
While this is certainly imperfect, it will allow us to explore all the data, including costs, across time.
This is an on-going process, so as the data continues to be analyzed, the chronology and costing analysis will be further refined, and the synopsis updated.
Clicking on any of the decade graphics will display all buildings that had work being done during that decade.


The building sequence is based on my on-site analysis of the construction history, using the techniques developed on the cathedral of Chartres called toichology, and described in a number of publications. The analysis of some of the smaller churches are more approximate than I would like, and need further analysis.
I have used 'phase' rather than 'campaign' to to identify a contiguous zone with similar elements. A campaign would be defined by recognisable breaks and construction joints in the fabric: there may be a number of phases within a campaign. One benefit is that separate programs by subcontractors, such as carvers, may be isolated, which is particularly useful in complex sections, such as portals.
Every phase has been assigned to a decade, so there may be more than one phase in a decade.
While this is certainly imperfect, it will allow us to explore all the data, including costs, across time. This is an on-going process, so as the data continues to be analyzed, the chronology and costing analysis will be further refined, and the synopsis updated.
Clicking on any of the decade graphics will display all buildings that had work being done during that decade.


